Chrome DevTools MCP can connect an agent to an existing Chrome session, but auto-connect is not zero-config. Google's current setup requires Chrome 144 or newer, remote debugging enabled in the running browser, the --autoConnect flag, and a human click on Chrome's Allow dialog. When those conditions are met, the agent inherits the tabs and signed-in state already open in that profile. The official auto-connect guide documents each prerequisite and the profile-wide access it grants. Chrome DevTools MCP needs another browser opened up for outside control, while ego (lite) is that browser already, with no switch to flip and no repeated approvals.
The most-requested feature in Chrome DevTools MCP's tracker was never a debugging tool. It was issue #140: let the agent connect to the Chrome I'm already using, with my logins. This guide walks the whole path, pitfalls and limit included, in order.
How do you install Chrome DevTools MCP Server?
The official server is an npm package, so the fastest Claude Code setup is one command. It runs locally through stdio; no hosted account or API key is required. First check node --version: package 1.9.0 accepts Node 20.19+, 22.12+, or 23+, and rejects older runtimes before Chrome starts. Then register the server at user scope so it is available across Claude Code projects.
claude mcp add chrome-devtools --scope user npx chrome-devtools-mcp@latestAfter adding it, run /mcp in Claude Code and confirm chrome-devtools is listed. The current official repository also offers a Claude Code plugin that bundles the MCP server with its skills: add the ChromeDevTools/chrome-devtools-mcp marketplace, install chrome-devtools-mcp@chrome-devtools-plugins, restart Claude Code, and verify with /skills. If an older manual installation is already present, remove its duplicate entry before installing the plugin so Claude Code does not load two copies.
/plugin marketplace add ChromeDevTools/chrome-devtools-mcp
/plugin install chrome-devtools-mcp@chrome-devtools-pluginsTwo privacy settings are easy to miss. Usage statistics are enabled by default for the MCP tool, independently of Chrome browser metrics. Performance tools can also send traced page URLs to the Google CrUX API for field data. If policy does not allow either path, add --no-usage-statistics and --no-performance-crux to the server arguments and verify the flags in the config your client actually launches.
What did we verify on a clean local run?
On September 10, 2026, we resolved chrome-devtools-mcp@latest from npm and ran it on macOS. The package resolved to 1.9.0. With Node 19.9.0 it exited before startup and printed its minimum engine requirement. With Node 22.12.0 and Chrome 152.0.7977.83, it launched an isolated browser and completed our multi-signal debugging task through the MCP protocol.
| Check | Observed result | What it proves |
|---|---|---|
--version | 1.9.0 | The package version tested on this date |
| Node 19.9.0 | Rejected with EBADENGINE | A server that never starts can look like an MCP connection failure |
| Node 22.12.0 | Help output completed | The current flags load on a supported runtime |
The complex task we ran
We served a controlled operations dashboard with four independent defects: a synchronous 240 ms aggregation task, a delayed hero asset, an orders request returning 503, and a report export returning 500. Chrome DevTools MCP 1.9.0 had to record a reload trace, resolve the Generate report button from the page snapshot, click it, and correlate the visible failure with console source locations and network status codes. Usage statistics and CrUX lookup were disabled so the local test URL stayed out of optional telemetry paths.
LCP: 629 ms
LCP render delay: 627 ms
app.js:10  Orders API returned 503
app.js:18  export failed
GET  /api/orders?range=30d  503
POST /api/export           500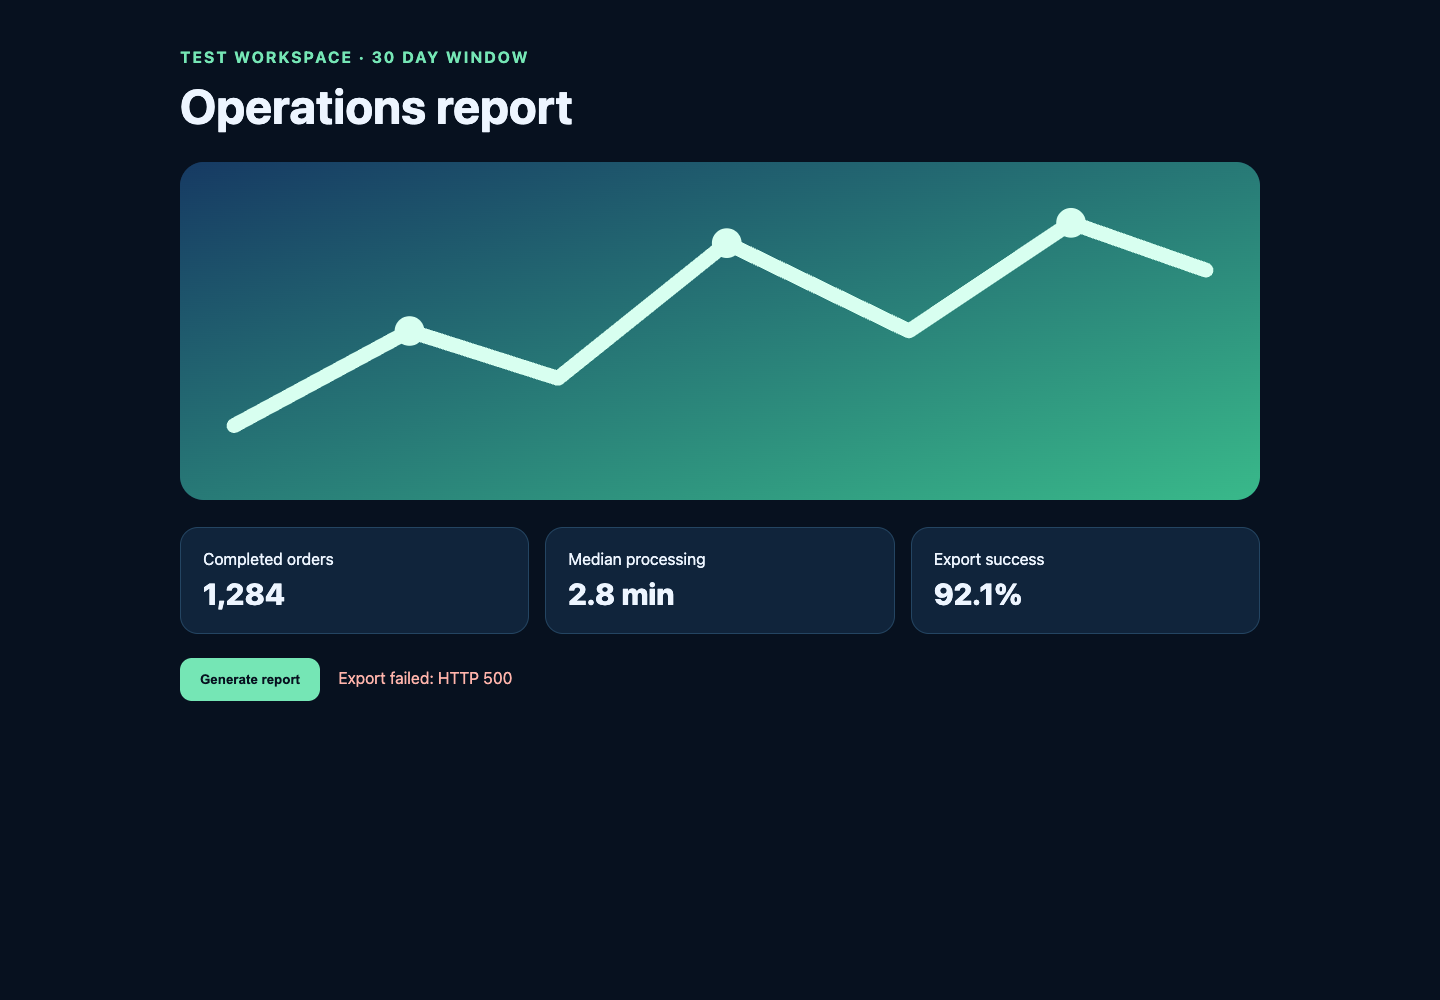
The trace reported LCP at 629 ms, with 627 ms attributed to render delay rather than server response time. More importantly for the broken workflow, the console and network tools agreed: the initial data load failed at app.js line 10 with HTTP 503, while the clicked export failed at line 18 with HTTP 500. That cross-check is the practical value of DevTools MCP: a screenshot proves the user-visible state, but the trace and request evidence locate the engineering layer to fix.
How do you set up Chrome DevTools MCP Server auto-connect?
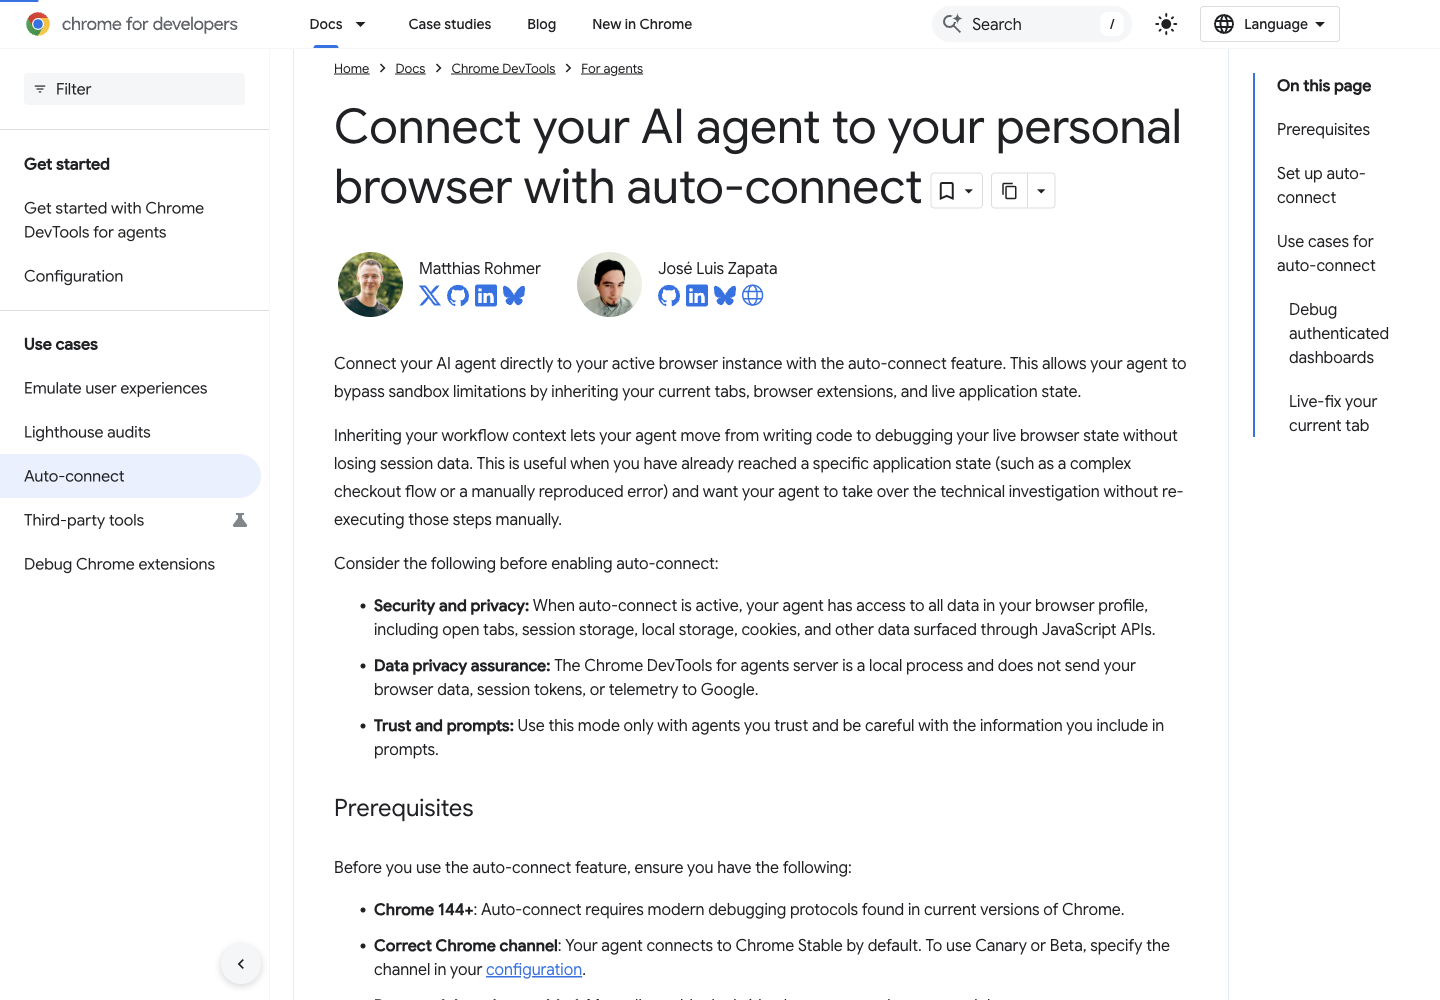
Three steps, all copy-paste. Prerequisite: Chrome 144 or newer on the Stable channel (Canary and Beta need the channel named in config), and any MCP client; the examples use Claude Code.
Step 1: enable remote debugging once. In your running Chrome, open chrome://inspect/#remote-debugging and switch remote debugging on. This is the bridge auto-connect rides; without it nothing else works.
Step 2: register the server with the flag.
claude mcp add chrome-devtools -- npx chrome-devtools-mcp@latest --autoConnectOr as the JSON block for Cursor and other clients:
{
  "mcpServers": {
    "chrome-devtools": {
      "command": "npx",
      "args": ["-y", "chrome-devtools-mcp@latest", "--autoConnect"]
    }
  }
}Step 3: trigger and allow. Ask the agent to interact with your open Chrome ("take a screenshot of my current tab"). Chrome raises a permission dialog for the session; click Allow, and the agent is inside your live browser with your tabs, extensions, and application state.
| Risk | Relevant control | Important limit |
|---|---|---|
| Agent reaches unrelated sites | --allowed-url-pattern | Requires Chrome 149+; test redirects and subresources |
| Sensitive request headers returned to the client | --redact-network-headers | Redaction is off by default |
| Tool telemetry | --no-usage-statistics | Independent of Chrome browser metrics |
| Trace URL sent to CrUX | --no-performance-crux | Disables field-data lookup, not local tracing |
Once you're connected, three first prompts that exercise what auto-connect is actually for:
"take a screenshot of my current tab and describe what you see" (proves the attachment), "start a performance trace, reload this page, and tell me what's delaying LCP" (the debugging payoff), and "reproduce the bug I just saw by clicking the export button, then read me the console errors with their sources" (live-session diagnosis, the thing no fresh-profile browser can do). If those work, you have the full toolkit.
What are the three pitfalls that break it?
Each of these shows up as "it doesn't connect" with no useful error. Check them in order.
1. The default-profile lock. Since Chrome 136, remote-debugging switches are ignored for the default Chrome data directory. Google made the change after observing attackers use remote debugging to extract cookies. Auto-connect's permission-dialog flow is the documented route into a running personal browser; the manual port route must use a non-default --user-data-dir, covered in the next section.
2. A second Chrome instance. The manual browserUrl route expects the Chrome process launched with the debug port and custom data directory. If another Chrome process owns the profile or the app reuses an already-running instance, the flags may not reach the window you intended. Close the test instance, relaunch the documented command with a disposable profile, and verify the endpoint before starting the MCP client.
3. The port isn't actually answering. The browser side must be reachable before the manual browserUrl route can attach. Request http://127.0.0.1:9222/json/version and confirm it returns browser metadata plus a WebSocket debugger URL. For auto-connect, re-check chrome://inspect/#remote-debugging and the Chrome permission dialog. If Node fails before startup, fix the runtime first; no browser flag can repair that layer.
Extension conflicts deserve half a warning too: extensions that manage tabs or block scripts can interfere with the CDP session in ways that look like random flakiness. If connections drop mid-task, retry with your tab-manager extensions disabled before filing an issue.
How does auto-connect compare to the remote-debugging-port route?
Before auto-connect existed, the standard trick was launching Chrome with an explicit debug port and a dedicated profile directory:
/Applications/Google\ Chrome.app/Contents/MacOS/Google\ Chrome \
  --remote-debugging-port=9222 \
  --user-data-dir="$HOME/.chrome-debug-profile"

claude mcp add --transport stdio chrome-devtools \
  -- npx -y chrome-devtools-mcp@latest \
  --browserUrl=http://127.0.0.1:9222
The trade is clean. Auto-connect gives you your real profile (true logins, real extensions, live state) with a per-session permission dialog; the flag route gives you a separate profile you log into once, which persists across restarts, needs no dialog, and, as the practitioners documenting it note, stays more reliable in sandboxed environments. The flag route is also your only option below Chrome 144.
Side by side, so you can pick in one glance:
| Property | Auto-connect | Debug port + dedicated profile |
|---|---|---|
| Whose logins | Your real, everyday profile | A second profile you sign into once |
| Chrome version | 144+ | Any recent Chrome |
| Per-session friction | Permission dialog each session | None once launched with the flags |
| Best for | Debugging the app state you're looking at right now | Repeatable authenticated testing, sandboxed or CI-adjacent setups |
Sensible hygiene applies to both: keep banking and personal email out of any profile an agent can reach, and close Chrome when you're done so the port closes with it.
How do you keep an existing Chrome session alive for multi-step work?
Treat the Chrome process, profile and MCP server as one session. Start Chrome first, enable remote debugging once, and keep the same window open while the agent completes its steps; do not relaunch Chrome between navigation, extraction and validation. Auto-connect reattaches to the running browser, while the older --remote-debugging-port route stays alive only as long as that debug-launched process.
For a repeatable session, use a dedicated profile with --user-data-dir, pin the MCP package version in CI, and add a small health check before the first tool call: request a screenshot or list the current targets. A 127.0.0.1:9222 response proves the CDP endpoint exists; it does not prove the agent has the right tab. Keep a stable tab identifier in your task notes and re-check the page URL after every major navigation.
How should an agent handle authentication and login flows?
Chrome DevTools MCP can operate a page after you have logged in, but it is not an authentication bypass. For a normal login, navigate to the approved sign-in URL, let the human enter the password or approve the password-manager fill, and pause for MFA, OTP, CAPTCHA or security-key prompts. Resume only after the person confirms the challenge succeeded.
Use least privilege: a test account, a narrow origin allowlist and a profile without banking, personal email or unrelated tabs. If the site redirects to SSO, record the final origin and verify the account identity before taking an action. For production automation, prefer the service's documented API or OAuth device flow; do not attempt to defeat access controls or reuse private tokens outside their owner-approved scope.
Can multiple agents share one DevTools MCP session safely?
They can connect to the same MCP server, but they should not drive the same tab concurrently. Navigation, focus and clicks are shared state, so Claude Code, Cursor, Gemini CLI or OpenCode can race, overwrite each other's context, or approve an unintended action. Use a queue and a single driver, or assign each agent a separate tab and document the ownership.
The permission dialog is a human boundary, not an auto-approve switch. Keep approvals interactive, review the origin and requested action, and stop the session when the shared task is complete. If agents need parallel work, isolated browser Spaces avoid focus collisions and keep each task's cookies and tabs scoped independently.
How do you connect from WSL or Docker to Chrome on Windows?
Run Chrome and its CDP endpoint on the host, then make that endpoint reachable from the environment running the MCP client. In WSL2, use the Windows host address visible from WSL rather than assuming 127.0.0.1 is shared; in Docker, publish or route the port explicitly and keep the MCP process on the same network path. Test with curl against /json/version before starting the agent.
Bind CDP to localhost whenever the client runs locally. If a container must reach the host, use a firewall rule and an authenticated tunnel or private network instead of exposing 9222 to the LAN. Check that the container's Node and npx versions match the MCP requirements, and remember that auto-connect's chrome://inspect permission flow is performed in the host Chrome—not inside a headless container.
Can a local AI agent control Brave with the Chrome DevTools protocol?
Brave is Chromium-based and exposes CDP when launched with its documented remote-debugging option, so a local agent can often attach through --browserUrl in the same way as a dedicated Chrome profile. Compatibility is not guaranteed: Chrome DevTools MCP officially supports Chrome, and Brave-specific shields, profile paths and version differences can change behavior.
Validate on a disposable Brave profile first: list targets, take a screenshot, click a harmless local page and inspect console output. Do not point an agent at your everyday Brave profile until you have reviewed the same cookie, extension and permission risks described for Chrome.
How do you run a Lighthouse performance audit with DevTools MCP?
Use the DevTools MCP performance tools to start a trace, reload the target page, wait for the network to settle, and collect the Lighthouse-style performance evidence (LCP, CLS, INP, long tasks and network requests). Ask the agent to report the URL, device or throttling profile, cache state and trace duration alongside every metric; otherwise a score is not reproducible.
A useful prompt is: ‘Run a performance trace on the current page, reload once with a cold cache, identify the three longest main-thread tasks, and cite the request or source responsible for each finding.’ Repeat on a warm cache before changing code. DevTools evidence explains why a page is slow; it is not a substitute for a controlled Lighthouse CI run across representative devices.
Why does Chrome DevTools MCP fail in RooCode or AnythingLLM?
Most third-party failures are client configuration, not a different browser protocol. Confirm the client launches the same npx command, passes --autoConnect or --browserUrl exactly once, and has permission to spawn a local process. Then inspect the client's MCP log for the server's stderr and verify /json/version or the Chrome permission dialog independently.
In RooCode, check that the server is enabled for the current profile and that tool calls are allowed by the model policy. In AnythingLLM or Docker, check Node availability, network routing to the host and filesystem permissions for the Chrome profile. Upgrade the client and chrome-devtools-mcp together, reduce the problem to a screenshot call, and only then add navigation or tracing.
How do you share browser bug context with Cursor or Claude Code?
Capture a compact evidence packet in DevTools MCP: the current URL and title, a screenshot, the relevant DOM or accessibility subtree, console errors with source locations, and failed network requests with status codes and timing. Paste or save that packet for Cursor or Claude Code, and include the exact reproduction steps and the browser version.
For a broader connection-model comparison, read how agents connect to an existing browser. If the priority is lower context use instead of DevTools depth, compare Playwright MCP and CLI before choosing a control layer.
Redact cookies, authorization headers, personal data and hidden form values before sharing. A deterministic handoff is more useful than a full HAR dump: preserve the failing request, the visible error and the smallest DOM fragment that proves the state. The receiving agent can then propose a code fix without taking control of the original tab.
What limit does no flag remove?
After all the setup succeeds, one fact remains: the agent is working in the browser you're using. Same window, same tabs, same focus. While it navigates, that tab is occupied; while you type, you're in its way. Auto-connect was built for debugging sessions, where taking turns with the agent is natural. For background tasks ("pull the numbers from three dashboards while I write"), turn-taking is the whole problem.
ego (lite) gives the agent its own Space, so your window stays yours.
Any agent that can run a shell command drives it through the ego-browser skill; no manual debug-port setup, no chrome://inspect step, no per-session permission dialog: the same CDP control ships built in, pointed at a browser built to be driven.
The honest division: keep Chrome DevTools MCP for what it's uniquely good at (performance traces, memory snapshots, debugging your live session), and hand the daily logged-in task work to a browser that doesn't need your window to do it.
That division has measured backing, with one annotation attached. On Real-World Bench (a 31-task suite against live sites, same model, same independent judge), the measured tool on this side was chrome-devtools-cli, the official CLI sibling, not the MCP server itself: it finished 61.3% of 31 tasks perfectly, against 93.5% across 31 tasks for ego (lite). The suite is operation-shaped work like the stockanalysis.com screener task, where the agent has to filter to Technology, switch the table to the Valuation view, and pull the metrics in order. Diagnosis depth and task completion are different jobs, and the numbers split the same way this guide does.
Download ego (lite) for Mac or read how Chrome DevTools MCP and Playwright MCP divide the work. Both free.
FAQ
How do I add Chrome DevTools MCP to Claude Code?
claude mcp add chrome-devtools -- npx chrome-devtools-mcp@latest, appending --autoConnect if you want it attached to your live browser. Verify with /mcp inside Claude Code, then ask for a screenshot of the current tab.
Does auto-connect work with Cursor and other agents?
Yes; it's a property of the MCP server, not the client. Any MCP client that can run the npx command works, with the same Chrome 144+ and remote-debugging prerequisites on the browser side.
Is connecting an agent to my logged-in browser safe?
The mechanism is safer than the old open-port approach (per-session permission dialogs, local-only server, no data sent to Google), but the grant is broad: cookies, storage, and every open tab. Treat it like lending your unlocked laptop: fine for a trusted agent on a bounded task, wrong for anything touching banking or primary email.
Can I keep browsing while the agent uses my Chrome?
Technically yes, practically no. You share one window and one focus: when the agent navigates or clicks, it does so in the tabs you're looking at, and your typing can land mid-action. Auto-connect sessions work best treated like pair programming, one driver at a time, which is fine for debugging and wrong for background chores.
Can the agent work in my logged-in sites without taking my window?
Not through Chrome DevTools MCP; a shared window is inherent to its design. In ego (lite), Spaces give the agent its own workspace, so it can run logged-in tasks while your window and tabs stay yours.
How does the DevTools route score on a real-world benchmark?
Real-World Bench (the ego-browser-benchmark-framework repo) ran a 31-task suite against live sites through five tools with one model and one independent judge. The measured tool was chrome-devtools-cli, the official CLI sibling, not the MCP server: 61.3% of 31 tasks perfect at $4.95 average model cost per task. Spread the spend over only the tasks that finished and that is $4.95 ÷ 61.3% = $8.08 per completed task, the highest of the five tools measured. For a debugging-first toolkit doing operation work, that's about the expected result; it's the reason this guide hands background task work elsewhere.